Last updated: September 10, 2026
Key Takeaways
- In a 30-year mortgage, that means 360 rows.
- Check that the term is in months if the table is monthly; a 30-year loan should usually show 360 rows.
- Some calculators let you add $50, $100, or another monthly principal prepayment.
- A difference of 1 cent per month over 360 months can produce a small rounding mismatch.
An amortization table in a mortgage calculator lays out, row by row, how each mortgage payment gets split between interest and principal, then shows how the balance shrinks over time. Read it well, and you can spot whether a loan is front-loaded with interest, how quickly equity builds, and what extra payments actually do. Simple enough. This is information, not financial advice; mortgage rules, rates, and tax treatment vary by country and change often, so for your own situation I would check the loan documents and speak with a qualified adviser. For consumer guidance on comparing mortgage costs, see the Consumer Financial Protection Bureau and your local regulator or lender disclosure.
Who this applies to, and what you need before you start

Anyone looking at a mortgage calculator that shows an amortization schedule falls into this group, whether the loan is a 15-year fixed, a 30-year fixed, or a variable-rate mortgage with a payment table projected at one rate. No advanced math needed. You do need three things: the loan amount, the interest rate, and the term in months or years. If the calculator also asks for property tax, insurance, PMI or mortgage insurance, or an escrow amount, those are separate line items and should not be confused with the loan’s own amortization.
The basic idea is straightforward: under a standard fixed-rate mortgage, each scheduled payment is usually the same amount, but the mix changes as time passes. Early on, most of the money covers interest charged on the larger outstanding balance. Later, more of it goes to principal, which is the part that cuts the balance down. Looks repetitive? It can. Still useful.
This section is not for people trying to compare every loan product in the market or predict an adjustable-rate reset years ahead. And if the calculator is modeling an ARM, a balloon mortgage, an interest-only period, or a loan with irregular extra principal payments, you can still read the table, but the schedule may not behave like the classic “same payment every month” version. In those cases, I would treat the table as a projection, not a promise, and I would verify the assumptions with the lender or a qualified mortgage professional.
What an amortization table actually shows
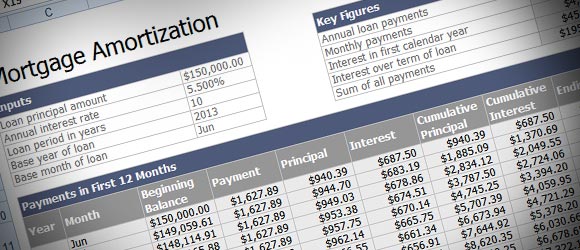
An amortization table shows the payment date, the payment amount, the interest part, the principal part, and the remaining balance after each payment. Those five pieces tell the whole story. The term “amortization” means paying down a debt over time through scheduled installments, not just paying interest forever and hoping the balance disappears.
A standard table usually has rows for each month. In a 30-year mortgage, that means 360 rows. Some calculators also add columns for cumulative interest paid and cumulative principal paid. Those columns help you answer a question many borrowers ask too late: how much of the loan cost is interest, not home value?
Here is the logic behind the numbers. Because interest is calculated on the unpaid balance, month 1 starts with the highest balance and therefore the highest interest portion. After that first payment, the principal remaining is a bit lower, so the next month’s interest is a bit lower too. The payment itself may stay fixed, but the split shifts gradually. If the table shows a payment that does not stay fixed, you are probably looking at a variable-rate or manually edited schedule. One weird row can smell off fast.
A practical way to read the table is to compare the first row, a middle row, and the final row. In many fixed-rate loans, the first row will show a small principal reduction. The middle rows will show a more balanced split. The final rows will show almost all principal and very little interest. If the final balance does not reach zero at the expected term end, the calculator may be using a different compounding assumption, rounding convention, or balloon payment structure.
How do I read the columns in a mortgage amortization table?
Start with the payment date, then check how much of that payment goes to interest, how much goes to principal, and how the remaining balance changes after each row. It is easier to follow one row left to right first, then compare several rows across time.
- Find the loan amount and term at the top of the calculator. Use the principal, not the home price, and note whether the term is 15, 20, 25, or 30 years. Make sure the term is shown in months if the table is monthly; a 30-year loan should usually show 360 rows. If the row count does not match the term, the schedule may be incomplete or based on a different payment frequency.
- Check the interest rate and whether it is annual nominal or effective. A nominal annual rate of 6% divided into 12 monthly periods can behave differently from an annual effective rate. Make sure the calculator states the compounding method. If the monthly interest charge looks too high or too low relative to the advertised rate, the calculator may be mixing annual and monthly assumptions.
- Read the payment amount first. The payment is the scheduled amount for each row in a standard fixed-rate schedule. Make sure you know whether escrow, tax, insurance, or mortgage insurance is included. If the payment looks larger than expected, a bundled escrow estimate may be inside it, which means the table is not showing principal and interest alone.
- Look at the interest column. This is the cost of borrowing for that period, usually calculated on the remaining balance. Make sure the first month’s interest is roughly the starting balance multiplied by the monthly rate, adjusted for the calculator’s rounding rules. If the interest number stays the same every month on a fixed-rate loan, something is wrong.
- Look at the principal column. This is the amount that reduces the balance. Make sure payment minus interest equals principal, unless the calculator separately rounds each column. If the principal is negative, the schedule is not a standard amortizing loan; it may be interest-only, deferred, or misconfigured.
- Check the remaining balance after the payment. The balance should fall by the principal amount in each row. Make sure it declines smoothly and reaches about zero at the last scheduled payment. If the ending balance is not near zero, there may be a balloon payment, an extra fee structure, or a rounding issue.
- Compare the first 12 rows with a later year. On a 30-year mortgage, the first year is where interest dominates. Make sure the principal share increases over time. If the split does not change much, the term may be very short, the rate may be low, or the table may not be amortized in the usual way.
- Look for any extra payment line. Some calculators let you add $50, $100, or another monthly principal prepayment. Check whether extra payments reduce the term, the payment, or both. If extra payments are treated as interest instead of principal, the calculator is wrong for a normal mortgage, so confirm the treatment with the lender or a qualified professional.
A quick check catches a lot of mistakes: on a fixed-rate loan, the interest portion should shrink a little each month while the principal portion grows a little. If both stay flat, you are probably looking at a simple payment summary, not a true amortization table.
Why the first 5 years look so interest-heavy
The first 5 years look interest-heavy because the balance is still close to the original loan amount, and interest is charged on what you still owe. That is not a flaw in the calculator; it is the shape of amortization. On a 30-year loan, a borrower can pay for months and still make surprisingly small progress against the principal at the start. Annoying? A little. Normal? Absolutely.
This is the part that often catches people off guard. They assume “I made a payment, so the balance should drop by about that much.” It does not. In a standard amortizing loan, the lender takes interest first, then applies the rest to principal. If the annual rate is high relative to the term, the early principal reduction is even smaller.
Reading this part of the table helps in two ways. First, it shows how long it takes to build meaningful equity from scheduled payments alone. Second, it shows why an extra principal payment can matter: when the balance is still large, an extra $100 or $200 goes straight to reducing the amount that future interest is charged on. I am not saying that makes extra payments right for everyone; it is simply what the table is showing.
This is also where a generic article tends to oversimplify. It says “more interest early on” and stops there. The better way to read the schedule is to track the balance drop over the first 12, 24, and 60 payments. If you can see how slowly the principal falls in those early rows, you can judge whether the payment structure fits your budget. If it feels too slow, the loan term, rate, or amortization method may not suit your circumstances.
What mistakes do people make when reading the table?
People usually make the same five mistakes, and each one can distort what the loan actually costs.
- They confuse total payment with principal and interest. The consequence is overestimating how much goes to the loan balance. Separate escrow, insurance, and taxes from the amortized loan payment.
- They ignore rounding. The consequence is being puzzled by a final balance that is a few cents or a few dollars off. Expect small rounding differences and check the last row, not every decimal.
- They assume every month is identical. The consequence is missing variable-rate changes, payment holidays, or odd first-period lengths. Confirm whether the table assumes fixed monthly compounding or something else.
- They read extra payments as if they reduce the payment first. The consequence is misunderstanding the benefit of principal prepayment. Check whether extra funds are applied to principal, shorten the term, or recast the payment.
- They treat the table as a legal contract. The consequence is relying on a projection that may not match servicing rules, escrow adjustments, or rate changes. Use the loan agreement, not the calculator, as the governing document, and confirm details with your lender or adviser.
A smaller but common mistake is comparing two calculators with different assumptions and calling one “wrong.” One may use monthly compounding, another daily interest accrual. Both can be legitimate if the underlying loan standard differs. That is why the assumptions box matters as much as the table itself.
When should you stop relying on the table alone?
Stop relying on the table alone when the loan structure stops being a plain fixed-rate amortizing mortgage. A table is a tool, not the contract. If the product has moving parts, the schedule can turn into a rough map instead of a reliable guide.
Variable or adjustable rate: The payment and interest share can change after the adjustment date — Use the table only for the current period and check the loan disclosure for the adjustment index and caps.
Interest-only period: The balance will not fall during the interest-only stage — Do not expect amortization until principal payments begin.
Balloon payment: The schedule may end with a large unpaid balance — Check the final row for a lump-sum due date and amount.
Negative amortization: The balance can rise if the payment is below the interest charge — Stop and review the loan terms, because the table is no longer showing normal payoff behavior.
Biweekly or irregular payments: Monthly tables can misstate the payoff date — Use the exact payment frequency in the calculator or ask for a schedule built around that cadence.
Rounding or servicing differences: A few cents per row can add up to a visible mismatch at the end — Ask the lender or servicer for the official amortization schedule.
If the table is being used to decide whether a refinance, recast, or prepayment strategy makes sense, I would want the underlying note, not just the calculator output. For a decision with real cost, a loan officer, mortgage broker, or other qualified adviser should review the exact terms in your jurisdiction. That is especially true if fees, prepayment penalties, or tax treatment might change the result.
Edge cases that change how you read the schedule
The standard reading changes whenever the loan is not a clean monthly, fixed-rate, fully amortizing mortgage. A few edge cases matter a lot.
Daily interest accrual is one. Some mortgages calculate interest on the actual number of days between payments, often using a 365-day basis or another standard set by local practice. In that case, a month is not just “1/12 of the year,” and the first payment after closing may look odd because the period length is shorter or longer than 30 days.
Another is a short first period. If closing happens mid-month, the first row can include per-diem interest for a partial month. That means the first payment’s interest amount may be lower or higher than the rows that follow. Do not mistake that for an error if the schedule clearly says “stub period” or “odd first payment.”
Prepayment rules are another edge case. Some loans allow extra principal with no fee; others have restrictions or penalties for early repayment. A calculator may show that extra principal cuts months off the schedule, but it cannot tell you whether your contract allows that behavior without cost. The schedule can show mathematical effect, not legal permission.
Finally, some calculators round to the nearest cent on each row, while others carry more decimal places internally and round only at the end. A difference of 1 cent per month over 360 months can produce a small mismatch. That is normal, as long as the table’s assumption is consistent. Tiny numbers, big noise.
How can I tell if the amortization table is right?
The table is probably right if the payment, interest, principal, and balance all fit the loan’s stated terms and the final balance reaches about zero by the expected maturity date. That does not prove every row is perfect, but it gives you a strong sanity check.
I would verify four things. First, the first month’s interest should be close to the opening balance multiplied by the periodic rate. Second, the principal should equal payment minus interest, unless the calculator says it rounds columns separately. Third