Last updated: September 10, 2026
Key Takeaways
- A 30-year mortgage should be 360 months, a 15-year mortgage 180 months.
- A 20-year mortgage entered as 20 months or 240 weeks will produce nonsense that still looks numerical.
- Need a sense check in under 5 minutes? This is the cleaner route.
- A 30-year loan is 360 months, not 30 periods.
Table of Contents
- Who this comparison is for, and what it assumes
- What a mortgage amortization calculator does better
- What a spreadsheet does better
- Which is better for most people?
- How do I build the comparison step by step?
- What mistakes do people make with amortization tools?
- When should you stop using a calculator and switch methods?
- What changes in the edge cases?
- What should a good result look like?
Quick answer: a mortgage amortization calculator works better for most people who want speed; a spreadsheet wins when you need to tweak assumptions, compare cases, or check the arithmetic yourself. Same mortgage amortization schedule either way — just the payment split between interest and principal, month by month. For your own situation, speak with a qualified adviser or lender.
Who this comparison is for, and what it assumes
This comparison fits anyone trying to understand a fixed-rate or adjustable-rate mortgage schedule before they sign, refinance, or make extra payments. I’m assuming you already know the basic mortgage terms: principal, interest rate, term, and monthly payment. And I’m also assuming you can type numbers into a calculator or spreadsheet and read the results.
So the real question is not “which tool is smarter?” It is “which one gets you the answer you need with the fewest bad assumptions?” For a plain 30-year fixed loan, a calculator usually gets you there faster. But if you plan to add $200 to principal each month, compare a 15-year against a 30-year term, or model a lump-sum payment after 18 months, a spreadsheet gives you more control. Simple as that.
I would not use either tool instead of the lender’s official closing disclosure or loan estimate. Those documents follow formal disclosure rules that vary by country and by product. A calculator or spreadsheet can show the shape of the loan, but it cannot change the contract, escrow charges, mortgage insurance, taxes, or fees already built into the loan offer. For disclosure basics, see the U.S. Consumer Financial Protection Bureau’s guides on the loan estimate and closing disclosure.
What a mortgage amortization calculator does better

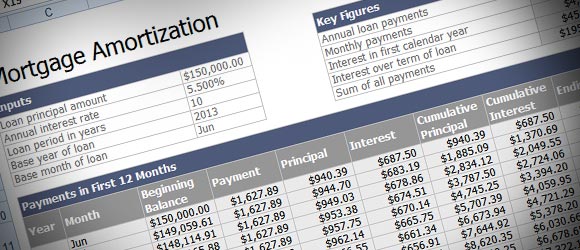
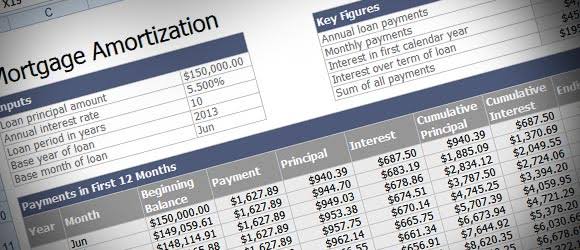
Speed. That’s the main draw. You enter the loan amount, annual interest rate, and term in months or years, and it returns the monthly payment plus a schedule showing how much goes to interest and principal over time. Many calculators also show the remaining balance after each payment, which is the unpaid principal.
That matters because the amortization formula is easy to misuse in a spreadsheet. One bad cell reference can throw off every payment after month 1. A calculator cuts down that risk because the formula stays hidden and the inputs are limited to a few fields. Need a sense check in under 5 minutes? This is the cleaner route.
Of course, calculators often flatten reality. Some only handle a single fixed rate. Some assume payments land on the same day each month with no odd first period. Some ignore extra principal, escrow, fees, or insurance. If the calculator does not show how it rounds, the balance may drift by a few cents after many payments. Harmless? Usually. Annoying when you are reconciling exact figures? Absolutely.
I’d use a calculator for the first pass and for sanity checks. I would not use it if I needed to compare three down-payment amounts, a biweekly payment plan, and an extra principal strategy all at once. For the payment formula itself, the CFPB’s loan estimate and the mortgage calculator examples are useful references.
What a spreadsheet does better
Control. That is where a spreadsheet pulls ahead. In Excel, Google Sheets, or LibreOffice Calc, you can build an amortization table row by row for 12, 180, or 360 months. Then you can change the rate, add a one-time payment, model a refinance after 24 months, or line up two loans side by side without depending on preset options.
The practical upside is transparency. You can see the formulas in each row — how interest equals prior balance times monthly rate, and how principal equals payment minus interest. If your spreadsheet uses the PMT function, that function calculates a constant payment for a loan with a fixed rate and fixed term. If you use IPMT or PPMT, those functions can break out the interest and principal portions by period. Standard stuff, yes, but still easy to botch. Microsoft documents these functions in its PMT, IPMT, and PPMT function guides.
But there’s a catch. A spreadsheet is only as solid as the user’s formula discipline. Miss a dollar sign, convert annual to monthly the wrong way, or copy a formula that shifts the reference, and you get a polished-looking schedule that is dead wrong. I’d trust a spreadsheet only if I can trace the key cells: loan amount, annual rate divided by 12, term in months, and the payment formula. If those are hidden or unchecked, the sheet is decoration, not analysis.
It is also slower for casual use. If you only want the payment on a $350,000 loan at 6.5% over 30 years, a calculator beats building 360 rows from scratch. No contest.
Which is better for most people?
A calculator is better for one-off questions; a spreadsheet is better for decisions with more than one moving part. That’s the cleanest answer.
If your question is, “What is my monthly payment?” use a calculator. If your question is, “What happens if I pay an extra $150 each month, then refinance in year 4, then compare that with a shorter term?” use a spreadsheet. The more scenarios you want to compare, the more the spreadsheet earns its keep.
There’s also a trust issue. Some readers trust calculators because they feel neutral. Others trust spreadsheets because they can inspect every formula. Honestly, both instincts make sense. The mistake is assuming that one format is automatically more accurate. Accuracy depends on the assumptions and the person entering them, not the shape of the tool.
For a standard fixed-rate mortgage, both tools should agree closely if they use the same inputs and the same rounding rules. If they do not, check the term units first. A 30-year loan is 360 months, not 30 periods. Then check whether the rate is annual or monthly. Then check whether the tool includes start-of-period versus end-of-period payment timing. Small setup slips can snowball fast.
If you are a borrower who mainly wants clarity before talking to a lender, I would start with a calculator. If you are actively comparing offers, prepayment plans, or refinance timing, I would build the spreadsheet. The right tool is the one that answers your actual question without forcing you to guess at hidden assumptions.
How do I build the comparison step by step?
Fix the same loan assumptions in both tools first, then change only one variable at a time. That’s usually the best way to tell whether the tool or the assumption is driving the result.
- Enter the loan amount exactly. Use the principal, such as $280,000, not the purchase price. Verify that the starting balance matches the note amount. If it includes taxes, insurance, or fees, something is wrong.
- Set the interest rate as an annual rate. Type the nominal annual rate, such as 6.25%, and let the tool convert it to a monthly rate. Verify that the monthly rate equals the annual rate divided by 12. A mismatch here breaks every later row.
- Choose the term in months. A 30-year mortgage should be 360 months, a 15-year mortgage 180 months. Verify the payment count. If the schedule shows 30 payments instead of 360, the term is probably entered incorrectly.
- Generate the base payment schedule. Confirm that the first payment splits into mostly interest and a smaller principal portion, which is normal at the start of amortization. If the principal portion is larger than expected on a fixed-rate loan, inspect the rate and term.
- Add one extra scenario at a time. For example, add $100 to principal monthly or a single $5,000 lump-sum payment in month 24. Verify that the balance drops only in the intended month. If every row changes unexpectedly, the formula is linked wrong.
- Compare total interest over the life of the loan. Check the sum of interest payments across the full schedule, not just the monthly payment. Verify that the comparison uses the same term and rate. If one loan has a shorter term, the interest total is not an apples-to-apples comparison.
- Test the remaining balance at a specific point. Look at month 12, 60, or 120 and note the outstanding principal. Verify that both tools report nearly the same balance, allowing for rounding. If the gap grows each month, one tool is using a different payment timing or rounding rule.
- Save the assumptions next to the output. Keep the rate, term, payment date convention, and any extra-payment rule visible in the file or notes. Verify that you can explain the schedule in one sentence. If you cannot, the model is too opaque to trust.
The point is not a prettier table. It is proving that your decision rests on the same assumptions in both tools. If the inputs do not match, the output does not mean much.
What mistakes do people make with amortization tools?
The most common mistake is entering the wrong time unit. A 20-year mortgage entered as 20 months or 240 weeks will produce nonsense that still looks numerical. The consequence is a fake payment and a fake payoff date. The fix is to confirm whether every field expects years, months, or periods.
Another mistake is ignoring rounding. Mortgage systems round cents on each payment, and spreadsheets may carry more decimal places unless you force rounding. The consequence is a small balance difference that can become confusing at the end of the term. The fix is to decide whether you want a lender-style rounded schedule or a theoretical one, then keep that choice consistent.
A third mistake is mixing up nominal rate and effective rate. A quoted 7% annual rate is not the same thing as a 7% monthly rate. The consequence is a payment far too high or far too low. The right move is to convert the annual rate to the periodic rate the tool expects.
A fourth mistake is comparing loans with different fees as if only the payment matters. Two loans with the same payment can have very different upfront costs or mortgage insurance rules. The consequence is a decision based on the wrong metric. The better move is to keep a separate note of fees and compare them outside the amortization table.
A fifth mistake is treating an extra payment as if it automatically lowers every future payment. In many loans, extra principal shortens the term unless the lender allows recasting or a payment change. Before assuming the payment changes, check the loan terms or ask a qualified lender or adviser. The consequence is misunderstanding the result. The fix is to verify whether the model keeps payment size constant and accelerates payoff, or recalculates the payment. The CFPB’s prepaying your mortgage guidance is a useful starting point.
A sixth mistake is relying on a spreadsheet that nobody can audit. If the formulas are hidden in a maze of tabs, one wrong cell can persist for months. The better move is a simple sheet with visible inputs, clear labels, and a separate check row.
When should you stop using a calculator and switch methods?
Stop using a basic calculator when the scenario has more than one variable, because the tool stops being reliable for decision-making. That is when a spreadsheet or a lender’s amortization schedule becomes the better model.
You want to compare more than two loan options: the calculator starts forcing repeated manual entries — switch to a spreadsheet so you can line up rates, terms, and payments side by side.
You plan extra principal payments of different sizes: this changes the payoff date and total interest — use a spreadsheet or a calculator that explicitly models extra payments rather than guessing from a basic schedule.
The loan has an adjustable rate, step rate, or interest-only period: these products do not follow a simple fixed amortization path — use the lender’s disclosure and a more detailed model, because the payment structure can change after the initial period.
You need to model a refinance, recast, or lump-sum payoff date: this creates a new balance and often a new term — a basic calculator will not handle the break in the schedule cleanly.
The lender’s numbers do not match the tool by more than rounding differences: this may mean fees, escrow, day-count conventions, or payment timing are different — stop trusting the simplified tool until you can reconcile the inputs.
You are trying to plan around tax or insurance effects: amortization tools do not replace tax or escrow analysis, so consult a qualified tax professional, insurance professional, or adviser for the specific treatment in your jurisdiction. The IRS Publication 530 and your insurer’s policy documents are better references for those questions than a payment schedule.
What changes in the edge cases?
The standard method needs adjustment when the loan is not a plain fixed-rate monthly mortgage. One hidden feature can wreck the whole schedule.
An interest-only period is the first common edge case. For those months, the payment may cover only interest, with no principal reduction. A standard amortization table that assumes immediate principal paydown will be wrong until the amortizing phase begins.
Biweekly payments are another edge case. Some lenders count 26 half-payments a year, which can speed principal reduction if applied correctly, but not every biweekly plan works the same way. If your schedule is biweekly, the tool must clearly state whether it is a true half-payment plan or just a monthly payment divided in two. The CFPB’s mortgage help pages and lender disclosures are useful references here.
Balloon loans are different again. A balloon structure can have low payments followed by a large final balance due on a specific date. A standard 360-row amortization table can hide that cliff unless the balloon date is built into the model.
Negative amortization is the most dangerous edge case for understanding, because the balance can increase if the payment does not cover all accruing interest. That is not a normal standard mortgage pattern. If your product allows this, a plain calculator is the wrong tool, and the loan documents deserve careful review.
Another edge case is irregular payment timing. If the first payment is delayed, or if you close mid-month, the first interest period may be shorter or longer than a standard month. That affects the first few rows and sometimes the total interest by a noticeable amount. In those cases, the lender’s schedule is the better reference than any generic calculator.
What should a good result look like?
A good result is not a single perfect number. It is a schedule that matches the loan terms, changes only when you tell it to, and can be explained in one minute. If the payment looks plausible, the balance falls each period on a fixed-rate loan, and both tools agree within rounding, the model is probably sound.
A good mortgage amortization schedule also makes the assumptions visible. You should be able to point to the rate, the term, the payment frequency, and any extra principal rule without hunting through hidden tabs or fields. If you cannot do that, the result may be polished but still untrustworthy.
That is why the calculator-versus-spreadsheet choice is not really about software. It is about how much control you need over the mortgage amortization assumptions, and how much time you want to spend checking them.